Instruction of VivaGuard Web for patient
Chart page
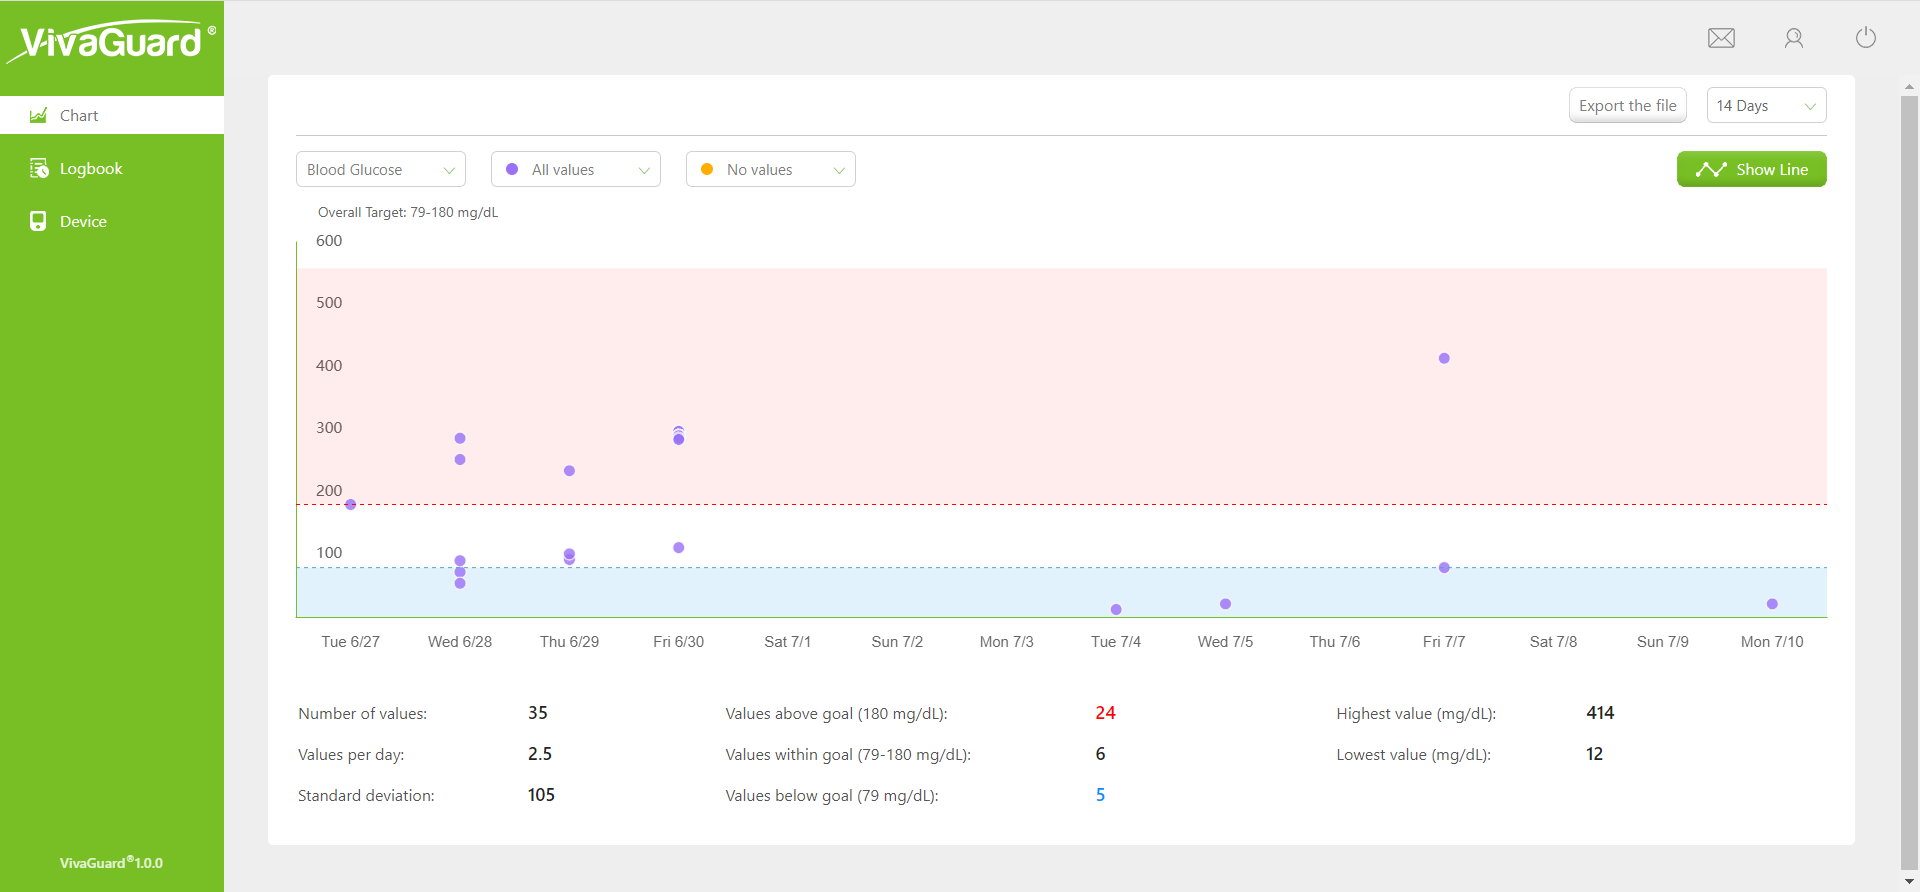
By default, this page displays a scatter chart of your blood sugar, blood ketones, and uric acid for the past 14 days. The items drop-down box can be used to toggle the items you want to view, click Show Line to switch to Hide Line, and two drop-down lists in the top left corner of the chart allow you to select time periods so that you can compare trends for each time period. Below the chart, you can see the statistics for the corresponding time. You can generate a PDF report with statistics by clicking the PDF button.
Logbook page
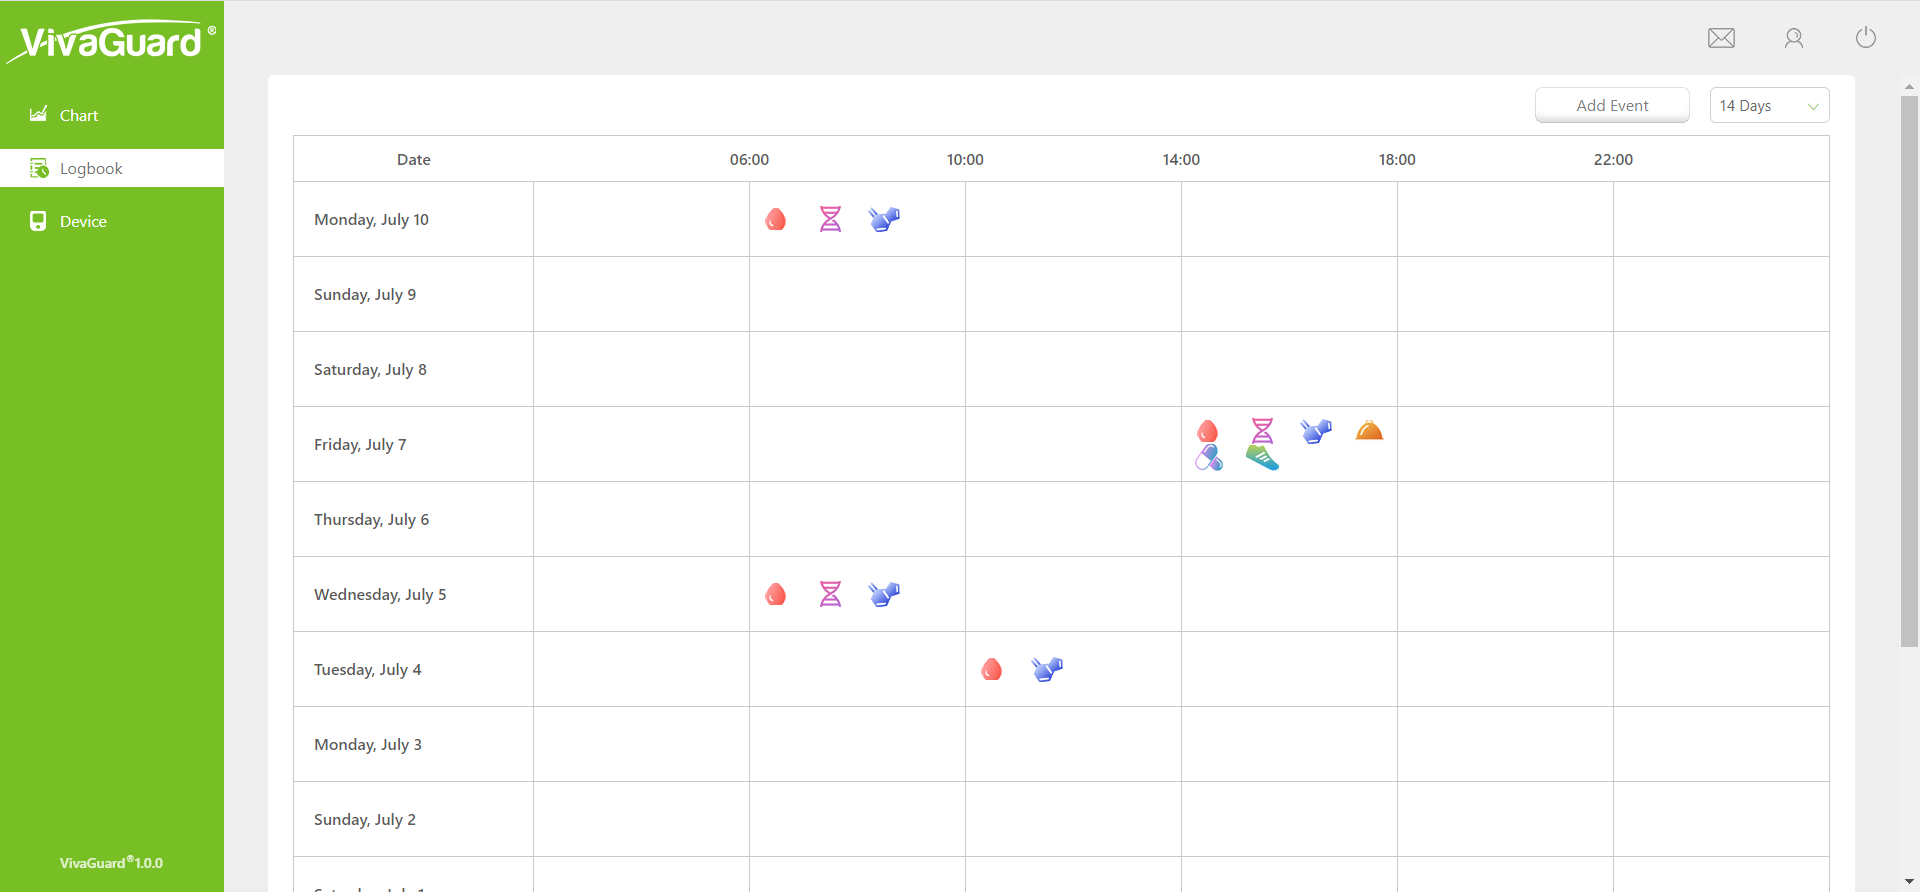
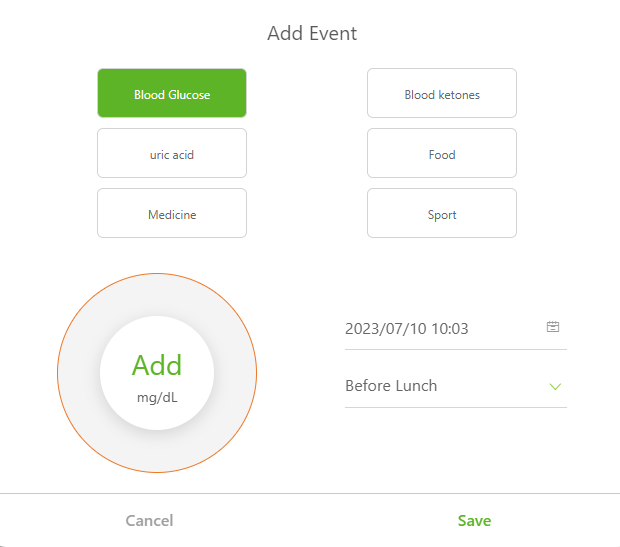
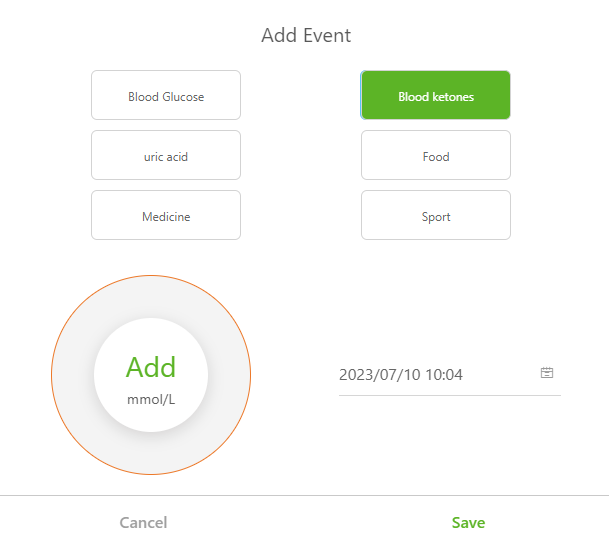
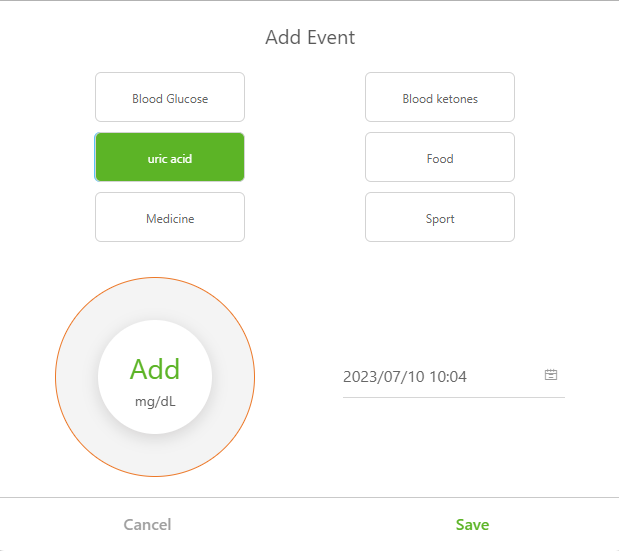
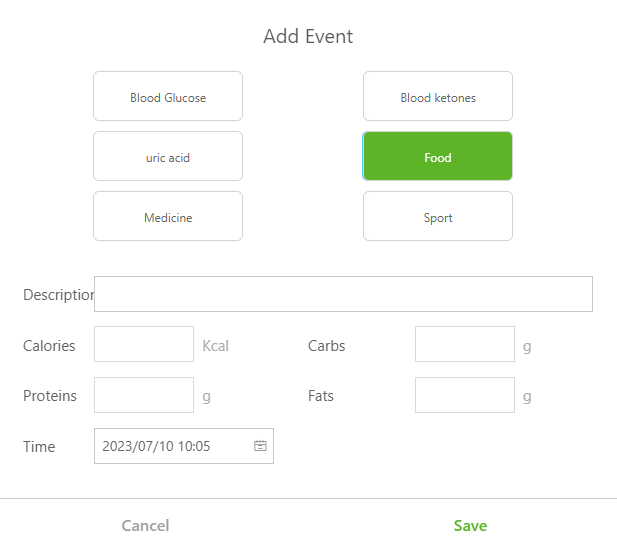
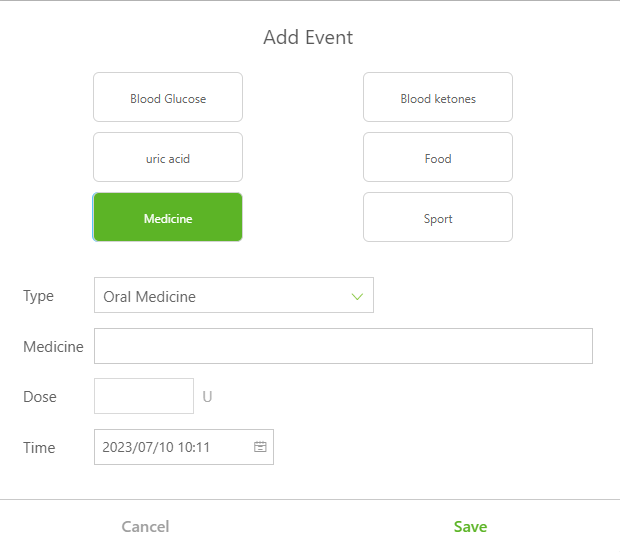
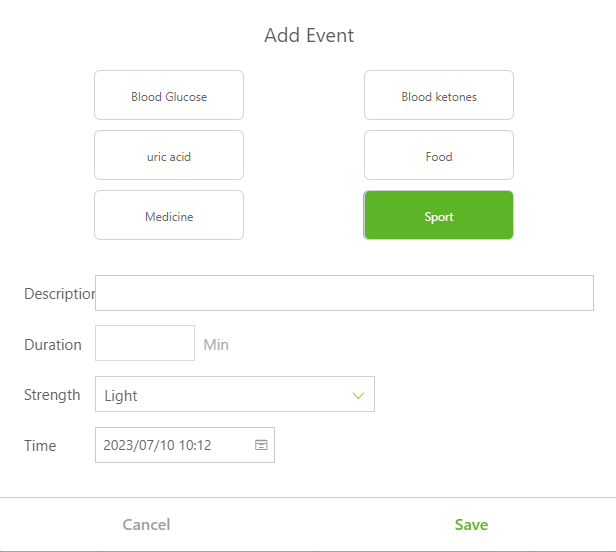
The table on this page shows the blood glucose, blood ketone, uric acid, diet, exercise and drug test records for 14 days, the table shows the date in vertical coordinate, the time in horizontal coordinate, and the events are represented by related ICONS. Hover the mouse over the icon, you can view the relevant data information, click to edit the data information; Click Add Event to manually add the data information of related items. You can select an existing time period from the time drop-down box or customize it.
Device page
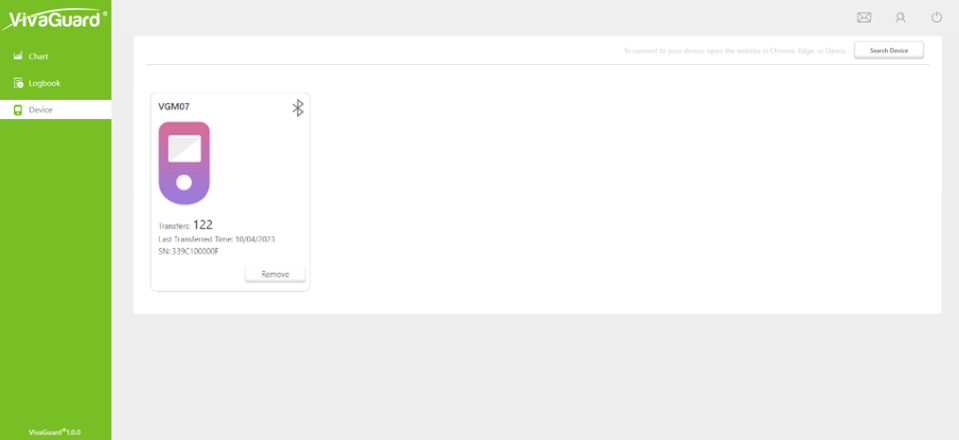
- The main functions of this page include: Bonded device, Delete device, Synchronize data;
- Bonded device: Connect the device to the computer with a data cable, and then click search device;
- Delete device: Click the Remove button on the device to delete the device;
- Synchronize data: This function synchronizes data from the device to the Web terminal.
Personal information
You can click the icon with your name on the upper right corner to view your personal information, including Profile, Password, Clinic, Settings, Help.
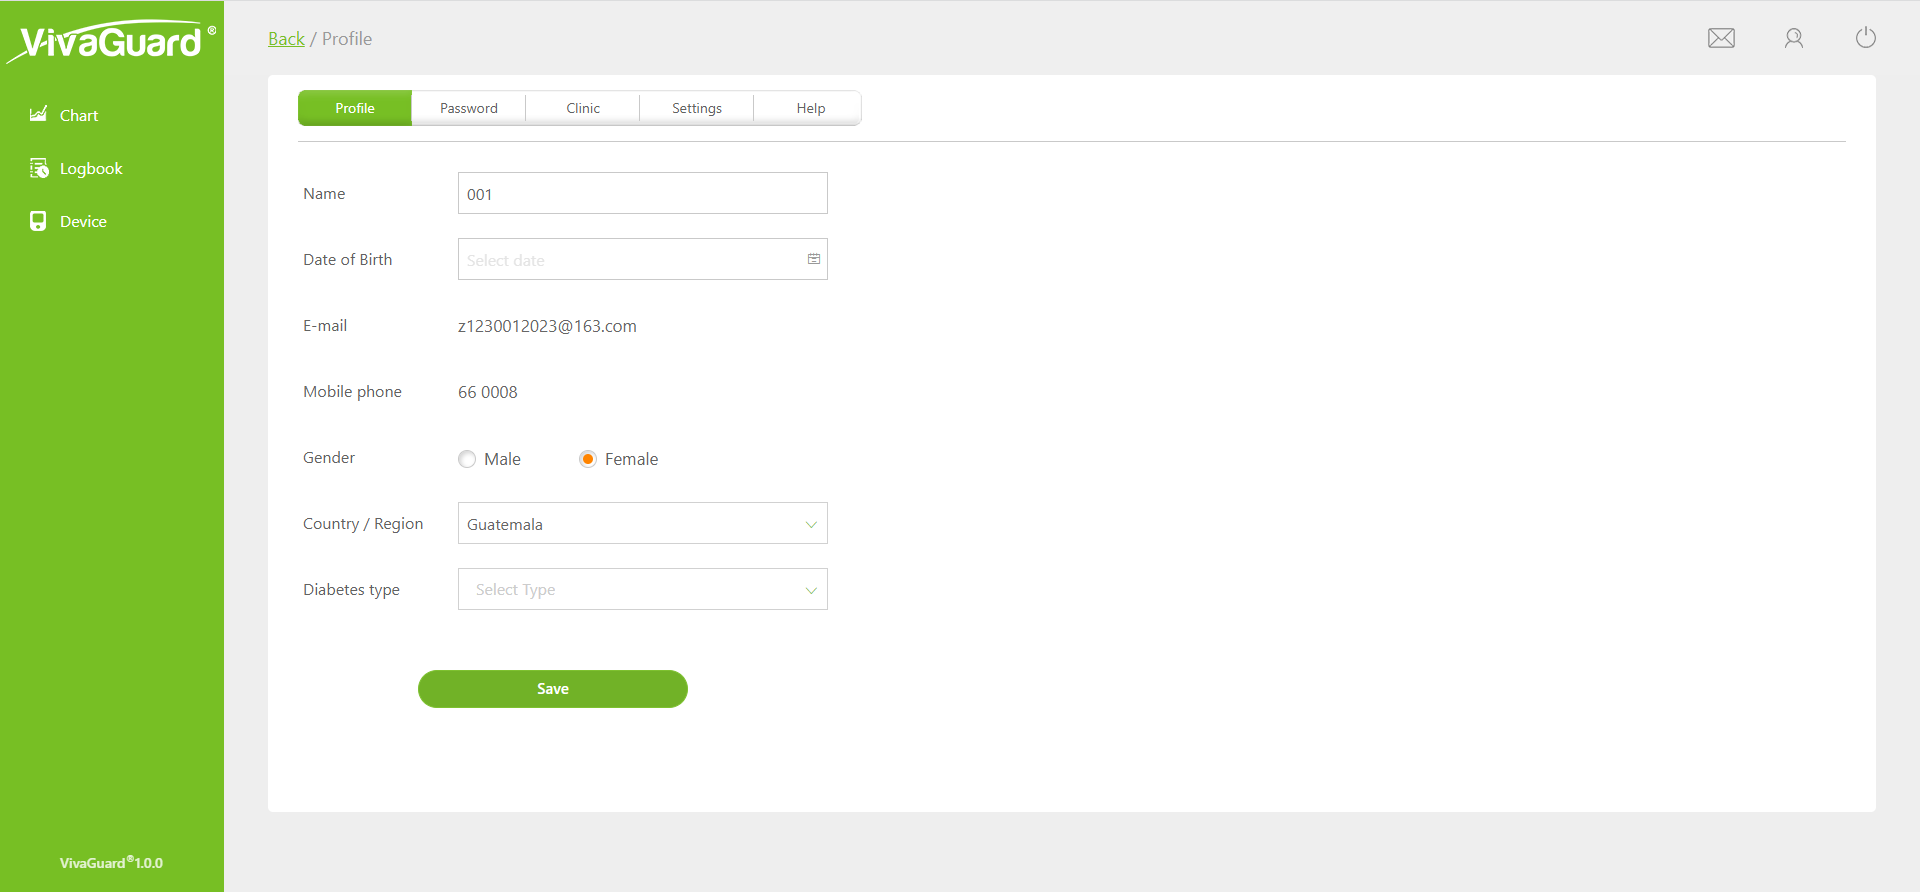
You can add clinic and share you data with your doctor or caregiver after entering the invitation code from them.
